

Building Custom Dashboards with KQL & Workbook Queries: Enhancing Visibility in Security Operations
Dashboard Dynamo

Visibility into your organization’s security posture is critical. Security Operations Centers (SOCs) rely on tools that provide actionable insights to detect, investigate, and respond to threats efficiently. Microsoft Sentinel (now part of Microsoft Defender XDR) empowers SOC teams to create custom dashboards using Kusto Query Language (KQL) and Azure Workbooks. These dashboards provide tailored visualizations to monitor security events, identify anomalies, and streamline incident response.
In this blog post, we’ll explore how to build custom dashboards with KQL and Workbook queries to enhance visibility in security operations. We’ll cover the basics, provide step-by-step instructions, and share practical examples to help you get started.
Why Custom Dashboards Matter in Security Operations
Custom dashboards address the unique needs of your SOC by:
Centralizing Insights: Aggregate data from multiple sources (e.g., logs, alerts, incidents) into a single view.
Improving Detection: Highlight patterns, trends, or anomalies that might indicate a security threat.
Streamlining Response: Provide analysts with quick access to relevant data for faster decision-making.
Tailoring Visualizations: Create charts, graphs, and tables that align with your team’s workflows and priorities.
By leveraging KQL and Workbooks, you can query vast amounts of security data and present it in a way that’s intuitive and actionable.
Prerequisites
Before diving in, ensure you have:
Access to Microsoft Sentinel/Defender XDR: You need permissions to create and edit Workbooks.
Basic KQL Knowledge: Familiarity with KQL syntax is helpful but not mandatory (we’ll provide examples).
Data Sources: Ensure your security data (e.g., Entra logs, Windows event logs, or network traffic) is ingested into Microsoft Sentinel.
Step-by-Step Guide to Building Custom Dashboards
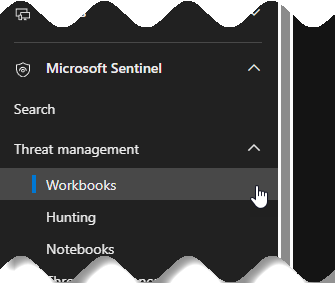
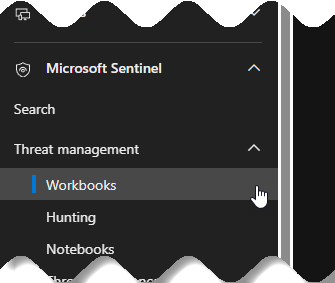
Step 1: Access Workbooks
Navigate to Microsoft Defender XDR or Microsoft Sentinel.
In the left-hand menu, select Microsoft Sentinel - Threat Management - Workbooks.
Click + New to create a new Workbook or choose an existing template to customize.
Step 2: Understand Workbook Components
Workbooks support various elements:
Text: Add markdown for instructions or context.
Parameters: Create dropdowns or filters for dynamic queries.
Queries: Use KQL to fetch and visualize data.
Visualizations: Display results as charts, tables, or tiles.
Step 3: Write KQL Queries
KQL is the backbone of your dashboard. It allows you to query logs stored in Azure Data Explorer or Log Analytics. Below are some example queries tailored for security operations.
Example 1: Monitor Failed Login Attempts
This query identifies failed Azure AD sign-in attempts, which could indicate brute-force attacks.
SigninLogs
| where ResultType != 0
| summarize FailedLogins = count() by UserPrincipalName, AppDisplayName
| order by FailedLogins desc
| limit 10Explanation: Filters for failed sign-ins (ResultType != 0), groups by user and application, counts occurrences, and sorts by frequency.
Visualization: Use a Bar Chart to show the top 10 users with failed logins.
Example 2: Detect Suspicious Process Execution
This query looks for unusual processes executed on Windows machines.
SecurityEvent
| where EventID == 4688
| where ProcessName contains "cmd.exe" or ProcessName contains "powershell.exe"
| summarize ProcessCount = count() by Computer, ProcessName
| where ProcessCount > 5Explanation: Filters for process creation events (EventID == 4688), focuses on cmd.exe or powershell.exe, and flags hosts with high execution counts.
Visualization: Use a Table to list computers and process counts.
Example 3: Alert Trends Over Time
This query tracks the number of security alerts over the past week.
SecurityAlert
| where TimeGenerated > ago(7d)
| summarize AlertCount = count() by bin(TimeGenerated, 1h), AlertName
| render timechartExplanation: Groups alerts by hour and name, counts occurrences, and plots them over time.
Visualization: Use a Time Chart to show alert trends.
Step 4: Add Queries to Your Workbook
In the Workbook editor, click Add Query.
Paste your KQL query into the query box.
Select a Visualization (e.g., Bar Chart, Time Chart, Table).
Optionally, set Parameters (e.g., time range or specific user) to make the query dynamic.
Click Done Editing to preview the visualization.
Step 5: Customize the Dashboard Layout
Add Text: Use markdown to provide context or instructions (e.g., “This chart shows failed login attempts over the past 24 hours”).
Rearrange Elements: Drag and drop query results, charts, or text blocks to organize the layout.
Add Parameters: Create dropdowns for time ranges, data sources, or specific entities (e.g., users, devices).
Example: Add a Time Range parameter with options like “Last 24 hours,” “Last 7 days,” etc.
Step 6: Save and Share
Click Save and give your Workbook a name (e.g., “SOC Threat Monitoring Dashboard”).
Share the Workbook with your team by assigning appropriate permissions in Azure.
Optionally, pin the Workbook to your Azure Portal dashboard for quick access.
Example Dashboard: SOC Threat Monitoring
Let’s combine the above queries into a sample SOC dashboard.
Dashboard Components
Header (Text):
markdown
# SOC Threat Monitoring Dashboard
Monitor key security metrics, including failed logins, suspicious processes, and alert trends.Parameter: Time Range
Options: Last 24 hours, Last 7 days, Last 30 days.
Visualization 1: Failed Login Attempts
Query: Use the failed login query from Example 1.
Visualization: Bar Chart showing top 10 users with failed logins.
Visualization 2: Suspicious Process Execution
Query: Use the process execution query from Example 2.
Visualization: Table listing computers and process counts.
Visualization 3: Alert Trends
Query: Use the alert trends query from Example 3.
Visualization: Time Chart showing alerts over time.
Sample Workbook JSON (Simplified)
If you prefer to import a pre-built Workbook, you can use the Azure Workbook JSON format. Below is a simplified snippet:
{
  "version": "Notebook/1.0",
  "items": [
    {
      "type": 1,
      "content": {
        "json": "# SOC Threat Monitoring Dashboard\nMonitor key security metrics."
      }
    },
    {
      "type": 9,
      "content": {
        "version": "KqlParameterItem/1.0",
        "parameters": [
          {
            "name": "TimeRange",
            "label": "Time Range",
            "type": 2,
            "typeSettings": {
              "selectableValues": [
                { "value": "24h", "label": "Last 24 hours" },
                { "value": "7d", "label": "Last 7 days" }
              ]
            }
          }
        ]
      }
    },
    {
      "type": 3,
      "content": {
        "version": "KqlItem/1.0",
        "query": "SigninLogs | where ResultType != 0 | summarize FailedLogins = count() by UserPrincipalName, AppDisplayName | order by FailedLogins desc | limit 10",
        "size": 1,
        "visualization": "barchart"
      }
    }
  ]
}
How to Use: Copy this JSON, go to the Workbook editor, click Advanced Editor, and paste it to import the structure.
Best Practices for Building Effective Dashboards
Keep It Simple: Focus on key metrics that align with your SOC’s priorities (e.g., high-risk alerts, anomalous behavior).
Use Clear Visualizations: Choose charts that make trends or outliers obvious (e.g., time charts for trends, tables for details).
Leverage Parameters: Allow analysts to filter data dynamically without editing queries.
Optimize Performance: Limit query time ranges and use summarization to reduce load times.
Iterate Based on Feedback: Regularly update the dashboard based on analyst input to ensure it remains relevant.
Enhancing Visibility with Advanced Techniques
To take your dashboards to the next level:
Incorporate Machine Learning: Use Microsoft Sentinel’s built-in ML capabilities to detect anomalies and display them in Workbooks.
Integrate Threat Intelligence: Join your KQL queries with threat intelligence feeds to highlight known malicious IPs or domains.
Automate Actions: Link dashboards to Playbooks (Azure Logic Apps) to trigger automated responses for critical alerts.
Conclusion
Custom dashboards built with KQL and Azure Workbooks empower SOC teams to gain deeper visibility into their security environment. By writing targeted KQL queries and leveraging Workbook visualizations, you can create intuitive, actionable dashboards tailored to your organization’s needs. Whether you’re monitoring failed logins, tracking suspicious processes, or analyzing alert trends, these tools help you stay one step ahead of threats.
Start small with the examples provided, experiment with different visualizations, and iterate based on your team’s feedback. With practice, you’ll unlock the full potential of Microsoft Sentinel’s analytics and visualization capabilities.
Happy dashboarding!