Go Beyond the Dashboard: Build Custom Garmin Data Views with KQL
KQL in the real world

Garmin’s ecosystem gives us powerful insights out of the box — VO2 max, training readiness, sleep scores, heart rate zones — but what if you're craving a next-level view of your fitness that goes beyond the built-in dashboards? What if you want to make it just a tad bit more personal?
That’s where the KQL for Garmin GitHub repo steps in — a growing collection of community-powered queries designed to transform your exported Garmin .csv files into actionable insights using Kusto Query Language (KQL) and Azure Data Explorer.
Why Use KQL for Garmin?
Garmin Connect is great for showing you a single run or this week’s stats — but what if you want to know:
How your heart rate drifted across long runs last month
Whether hot days actually spiked your training stress
Which strength sessions delivered the most reps, week over week
How elevation gain has trended throughout your training block
What your most common activity types are — and when you typically log them
With KQL, you can ask questions like these — and answer them yourself with clarity, flexibility, and speed.
What You'll Find in the Repo
The KQL for Garmin repo includes:
Parsing templates for common CSV exports (like
Activities.csv)Query snippets to slice your fitness data by activity type, heart rate, duration, elevation, pace, temperature, reps, and more
Troubleshooting tips for common data ingestion quirks in Azure Data Explorer (because let’s face it — not every Garmin field plays nice)
Whether you’re brand new to KQL or fluent in timecharts, this repo helps you spin up insights in minutes.
Use Cases: What You Can Build
Weekly Effort Summary: Track minutes spent per activity each week, visualized as a heatmap
HR vs. Temperature: Spot correlation between environmental stress and cardiovascular strain
Strength Volume Tracker: Compare reps and sets over time to measure lifting consistency
Pace Efficiency Report: See where your effort is high but pace is low, hinting at fatigue
Multi-Activity Days: Spot which days you stacked workouts (and how much)
You can also combine fields Garmin doesn’t visualize — like Best Lap Time vs. Training Stress Score — or bring in weather data, race results, or wellness scores for even deeper context.
Who This Is For
This repo is built for:
🧪 Data tinkerers who want to explore Garmin metrics in new ways
📈 Athletes and coaches seeking long-term pattern recognition
🧱 Builders and devs curious about Azure Data Explorer for quantified self-data
👋 Anyone who asks “Why can’t Garmin just show me a weekly climb total by activity type in a histogram?”
Get Started
Head to the repo: https://github.com/rod-trent/GarminKQL/
Export your Garmin fitness data (typically from Garmin Connect → All Activities→ Export → Activities.csv)

Ingest the data into Azure Data Explorer, Log Analytics, or even Power BI via KQL-backed connectors. My goto is the free Kusto resource: https://aka.ms/KustoFree
Run the sample queries, tweak them for your goals, and start building the views you care about.
Grow the Collection
Have your own killer query? Submit a pull request or open an issue. The vision for this repo is a living library — a place where runners, riders, lifters, and movers of all kinds can explore what’s really happening under the hood of their training.
Ready to level up your insight game? Dive into the repo, bend your Garmin data to your will, and build dashboards your future self will thank you for.
NOTE: The KQL queries in the GitHub repo are all based on a Garmin table, but you can name the table anything you want. Just don’t forget to modify the table name in the KQL queries to match your table name.
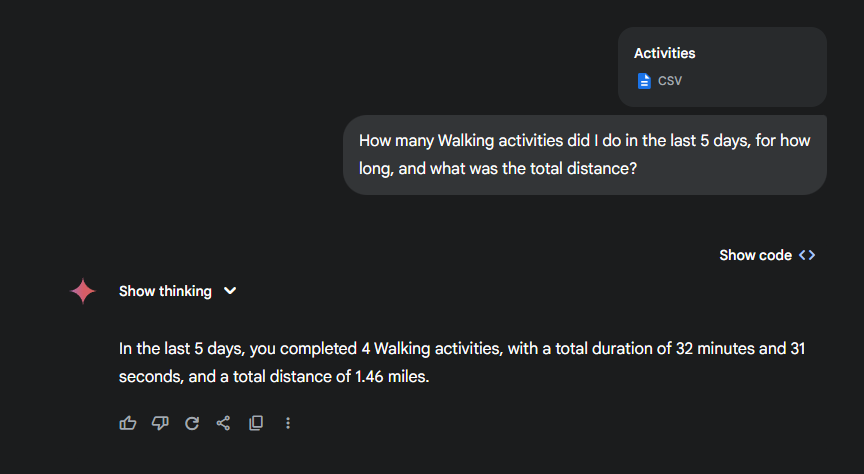
Incidentally, you can also upload the Activities.csv file from Garmin to your favorite GenAI assistant and just ask the questions there (no KQL required). But what fun is that?